Thursday, May 29, 2014
More Could Shoulda Woulda...
Ive been getting frustrated lately, because I havent been acting upon my thoughts. I wanted to set up a long trade on NFLX, FB, AMZN, and TSLA... also wanted to buy AAPL after earnings because I sensed a magnetic pull towards 600. But no. I did none of that.
Sunday, May 25, 2014
May 23 Weekend Review
Bflakaz Weekend Review
May 25, 2014
Happy Memorial Day!
Recap of Previous Week's Trades
There were no trades put on last week
Management of Current Positions
There are no current positions
Trade Setups for the Upcoming Week
Headed off to the Big Apple next week, so, ironically, I won't be doing any trading! What I have set up, though, is a little test of my previously alluded to standard deviations theory. What I've done is "sold" 10 iron conders with strikes 1SD OTM in stocks with IV of 30%-50% for June expiration. They are:
- Netflix NFLX
- Zillow Z
- Visa V
- First Solar FSLR
- Tesla TSLA
- Hewlett-Packard HPQ
- Twitter TWTR
- Pandora P
- FireEye FEYE
- 3D Systems DDD
The plan is to "hold" these to expiration and see if I can attain max profit - the entire credit. Really, I'm just recording daily prices of spreads.
Have a great weekend!
Saturday, May 17, 2014
May 16 Weekend Review
Bflakaz Weekend Review
May 16, 2014
Recap of Previous Week's Trades
- QQQ -85 shares @ 87.54, covered 88, loss = -$37.72
- IWM -75 shares @ 111.20, covered 112.45, loss = -$93.75
- QQQ +2 JUN14 89.63 calls @ 0.95, out @ 0.74, loss = -$42
- DE +3 JUN14 92.5 calls @ 1.02, out @ 1.28, profit = $72
- NFLX -8 JUN14 295/300/400/405 iron condor @ 0.82 (TEST)**
Management of Current Positions
NFLX
Ok, this is going to get a little complicated. Time for an in-depth explanation of a specific option trade.
First, what is an option contract? An option contract is a type of derivative (levered asset) that is an agreement between buyer and seller. The buyer of a call option has the right, not the obligation, to buy a security (in this case, shares of stock) from the writer at a certain price, known as the strike price, on or before a specified date, the expiration. The buyer of a put option has the right, not the obligation, to sell a security to the writer at the strike price on or before expiration. Each contract is good for 100 shares of the underlying stock, and the holder of a contract can exercise the right any time before or on the expiration date.
When observing option prices, it is helpful to know some terms that help determine extrinsic vs intrinsic value. Strikes that are close to the underlying security's current price are known as "At the Money (ATM)," and have no intrinsic value. Strikes at this range usually have a Delta of about 0.5, or a 50% of expiring "In the Money (ITM)," or with intrinsic value. Strikes far from the ATM strike are known as "Out of the Money (OTM)," and have a much smaller chance of expiring ITM.
Intrinsic value, in the option world, just means being rational. For example, XYZ Corp is currently trading at $50. I own a call option that expires in 30 days at the 45 strike. It would be a good idea to exercise my right to buy 100 shares of XYZ at $45, or I could sell my call option on the open market for a substantial profit as well. Since the contract is ITM, it has intrinsic value because it can immediately be exercised for a profit.
Extrinsic value means that it has no immediate value to an investor. Extrinsic value begins to rapidly decline in the last 60 days to expiration, because the chances of the contract expiring ITM begins to diminish. More on that later.
Here's a look at an option chain for General Electric (GE):

Now there's how options are priced. There are 5 main factors, or "sensitivities," that determine the price of an option, notated by financial Greek letters. Underlying price (Delta), volatility (Vega), time value (Theta), price change sensitivity (Gamma), and interest rates (Rho).
The only three that really matter are Delta, Theta, and Vega. Delta is determined by standard deviations on a bell curve. If you have no statistical background, it's simply a curve of probabilities. In this case, probabilities of expiring ITM.

Let the underlying price of the security be u. According to standard Gaussian Theory, the price of the security at the time of expiration will have a 68.2% chance of being within -1o and 1o, or within 1 standard deviation. There is a 95.4% chance of being within 2 SD, and 99.7% of being within 3 SD.
So then there's Theta or Time Value. Essentially, the more time there is to expiration, the more time there is to "be right" and have an option contract become ITM or gain intrinsic value. Extrinsic value, "the chance to be right," dwindles as time nears expiration, therefore so does option premium (the price paid for a particular contract). Theta decays geometrically, as exemplified by this chart:

The most rapid decline in Time Value occurs in the last 30 days to expiration. Don't worry, this will all come full circle soon.
Then there's the all important Vega, or Implied Volatility. Option premium is largely derived from how volatile price swings in the underlying security are. More volatility = increased risk = higher option premium. For example, a stock like Zillow (Z) has larger price fluctuations than General Electric (GE), therefore, the premium in Z options will be much greater than premium in GE options, regardless of underlying stock price differences (Z being at around 100 and GE at 26).
So how does this fit into the trade? The plan is this: sell an option spread of both puts and calls with a wide range between the sold strikes in order to capture the decay of time value, remain delta neutral, and utilize higher volatility for a better payout resulting from higher option premium. That's a mouthful, so hopefully a visual representation will clarify:

The top model is the risk profile of the trade while the bottom model is the visual representation of the aforementioned statement. The risk profile shows our profit and losses upon expiration based on the underlying price. The spectral map shows our % market gain at underlying prices with days to expiration (DTE). Theta is shown by the curve becoming more green as time passes. Since IV (Vega) in the underlying is high (40%), losses within the 1SD curve are insignificant. And the position is Delta neutral since a rise or fall in underlying price will hurt market returns, until expiration of course.
So what we end up getting is an 80% chance of collecting the entire premium sold for the trade, what's call net credit. It can also be described as being having a Risk/Reward Ratio (R/R) of 1/.20, or 5/1: five dollars of risk for every 1 dollar rewarded. That sounds bad, but when you consider it's statistical chance of "being right," that's actually pretty good. Higher IV lets us widen our strikes beyond 1SD while still collecting a good net credit.
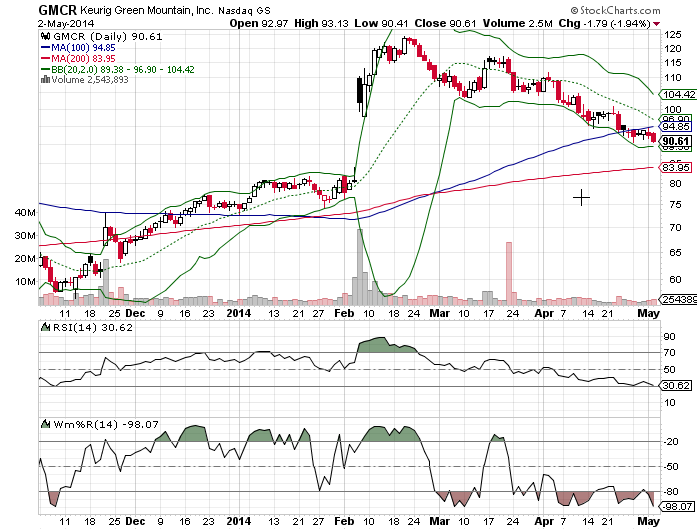
Part of every trade is the timing in which you place your position. According to the chart of NFLX, it looks like an alright time to make this kind of trade.

NFLX appears to be consolidating, based on the chart and the RSI. That means having a Delta neutral position won't be as risky.
**TEST means that this trade isn't actually being put on. Trading option spreads based on SD is totally new to me, so I'm not going to risk hard-earned profits on something I've never exactly done before.
Now that you (anyone who reads this, which is probably nobody) understand how options work, maybe you can see why Math is actually important and can actually make you money. Who knew, right? Since this trade has a R/R of 1/.20, that means it has a return of 20% of capital, with and 80% chance of that occurring. So, if you were able to successfully trade one of these spreads every month / 30 days, you would have an annualized return of 240% ROC. That's incredible! You would be able to turn $25,000 (fully invested) into $85,000 in a year!
Let the underlying price of the security be u. According to standard Gaussian Theory, the price of the security at the time of expiration will have a 68.2% chance of being within -1o and 1o, or within 1 standard deviation. There is a 95.4% chance of being within 2 SD, and 99.7% of being within 3 SD.
So then there's Theta or Time Value. Essentially, the more time there is to expiration, the more time there is to "be right" and have an option contract become ITM or gain intrinsic value. Extrinsic value, "the chance to be right," dwindles as time nears expiration, therefore so does option premium (the price paid for a particular contract). Theta decays geometrically, as exemplified by this chart:
The most rapid decline in Time Value occurs in the last 30 days to expiration. Don't worry, this will all come full circle soon.
Then there's the all important Vega, or Implied Volatility. Option premium is largely derived from how volatile price swings in the underlying security are. More volatility = increased risk = higher option premium. For example, a stock like Zillow (Z) has larger price fluctuations than General Electric (GE), therefore, the premium in Z options will be much greater than premium in GE options, regardless of underlying stock price differences (Z being at around 100 and GE at 26).
So how does this fit into the trade? The plan is this: sell an option spread of both puts and calls with a wide range between the sold strikes in order to capture the decay of time value, remain delta neutral, and utilize higher volatility for a better payout resulting from higher option premium. That's a mouthful, so hopefully a visual representation will clarify:
The top model is the risk profile of the trade while the bottom model is the visual representation of the aforementioned statement. The risk profile shows our profit and losses upon expiration based on the underlying price. The spectral map shows our % market gain at underlying prices with days to expiration (DTE). Theta is shown by the curve becoming more green as time passes. Since IV (Vega) in the underlying is high (40%), losses within the 1SD curve are insignificant. And the position is Delta neutral since a rise or fall in underlying price will hurt market returns, until expiration of course.
So what we end up getting is an 80% chance of collecting the entire premium sold for the trade, what's call net credit. It can also be described as being having a Risk/Reward Ratio (R/R) of 1/.20, or 5/1: five dollars of risk for every 1 dollar rewarded. That sounds bad, but when you consider it's statistical chance of "being right," that's actually pretty good. Higher IV lets us widen our strikes beyond 1SD while still collecting a good net credit.
Part of every trade is the timing in which you place your position. According to the chart of NFLX, it looks like an alright time to make this kind of trade.
NFLX appears to be consolidating, based on the chart and the RSI. That means having a Delta neutral position won't be as risky.
**TEST means that this trade isn't actually being put on. Trading option spreads based on SD is totally new to me, so I'm not going to risk hard-earned profits on something I've never exactly done before.
Now that you (anyone who reads this, which is probably nobody) understand how options work, maybe you can see why Math is actually important and can actually make you money. Who knew, right? Since this trade has a R/R of 1/.20, that means it has a return of 20% of capital, with and 80% chance of that occurring. So, if you were able to successfully trade one of these spreads every month / 30 days, you would have an annualized return of 240% ROC. That's incredible! You would be able to turn $25,000 (fully invested) into $85,000 in a year!
Trade Setups for the Upcoming Week
Watch NFLX and look for other opportunities... that sounds vague but I pretty much have a blank white board right now. I think that markets are headed for the usual Summer doldrums and we will pull back a little, maybe a lot, in the next couple months.
Some Side Notes
Maybe if this post garners readers who are interested by statistical analysis (HIGHLY DOUBTFUL), I will post more technical and challenging stuff, mostly on Economics and Macro trends. Oh yeah, the boring stuff!
Friday, May 16, 2014
DE success, though modest.
DE did pop today and I sold at lunchtime (luckily at the highs of the day) for 1.28, netting a profit of $78 (+25.5%). It's not much, but it covers what I lost on the QQQ calls. Wasn't looking for a big move here, just a little short term oversold bounce.
What's interesting is that I was kicking myself for taking it off so early, but very shortly after, Goldman Sachs issued a Sell rating on DE, which brought it back down to close +0.07%. Lucky me, I guess. It will be kinda shitty if DE pops up on Monday. >.>
What's interesting is that I was kicking myself for taking it off so early, but very shortly after, Goldman Sachs issued a Sell rating on DE, which brought it back down to close +0.07%. Lucky me, I guess. It will be kinda shitty if DE pops up on Monday. >.>
Thursday, May 15, 2014
Bollinger Scalp Opportunity: Deere & Co. (DE)
What are Bollinger Bands? They're channels plotted 2 standard deviations (SD) away from a simple moving average (MA). These are powerful technical analysis tools that allow support / resistance players (myself) to make short term "scalp" plays. Essentially, the price of the stock will stay within BB unless there's a "black swan" event or there is a large price spike from earnings. Therefore, anytime the price of a stock closes significantly outside of BB, there's a very good chance that it will quickly ascend / descend back within the bands.
The most widely recognized BB is the 20MA, denoted as 20, 2. Let's take a look at a chart of DE.

Notice how that last candle is completely outside of the bottom band. W%R is also now in oversold territory, and DE closed above its 50MA. In addition, the overall market may be due for a little snap back tomorrow, as I believe it was oversold on bad Walmart earnings and sluggish CPI, of all things.
Here's the trade: +3 DE JUN14 92.5 calls @ 1.02
The most widely recognized BB is the 20MA, denoted as 20, 2. Let's take a look at a chart of DE.
Notice how that last candle is completely outside of the bottom band. W%R is also now in oversold territory, and DE closed above its 50MA. In addition, the overall market may be due for a little snap back tomorrow, as I believe it was oversold on bad Walmart earnings and sluggish CPI, of all things.
Here's the trade: +3 DE JUN14 92.5 calls @ 1.02
Whipsawed.
Investopedia defines the term whipsaw:
A condition where a security's price heads in one direction, but then is followed quickly by a movement in the opposite direction. The origins of term is derived from the push and pull action used by lumberjacks to cut wood with a type of saw with the same name.
My IWM trade looked like this:

Entered the short @ 111.20, covered @ 112.45 for a loss of -$93.75. First, I should have (hindsight 20/20) covered @ 108.50 the next day for a quick profit... but decided that this time I was going to hang on to positions in order to avoid the GMCR mistake of exiting early. Instead, I held and when IWM gapped up above the 200MA and the market was making a new all time high, I quibbled and got shaken out. Then IWM immediately has 3 big down days and I could have been well in the profit, especially since I was considering adding to the short! -75 @ 111.20 + -25 @ 112.45 and covering at 107.89 would have netted $362.25. Argh!
Not only has IWM frustrated me, QQQ has even more! Look at this break out and subsequent failure:

Entered short -85 @ 87.54, covered @ 88, then followed by buying +2 JUN14 89.63 calls for 0.95. Two days later QQQ sells of and is back under 88 and the 50MA, previous resistance points. Monday showed a breakout, but apparently it was a false one. Sold the calls for 0.74, a loss of -$42, making QQQ total loss -$79.72. Unlike IWM, I did not consider adding to short, I thought this was a clean break. Oh well.
These aren't large losses. In fact, they're trivial. But it's frustrating as hell when you have winners that quickly become losers, and then on top of that, proceeding to get whipsawed.
The main methodology I use in my trading is support / resistance and overbought / oversold, in case nobody noticed. This method works very well in trending markets, and not so much in sideways markets. This is where my lack of experience shows... knowing how to read a true breakout versus a false one. Although I have made immense progress as a trader and investor, I have a long way to go!
Monday, May 12, 2014
Shorts Flushed... the Other Side of the Coin
Well, I was worried that this would happen. IWM and QQQ gapped up this morning. IWM definitely rose near 3% due to short covering, myself included. So, THIS is the official end to the hot streak, and it also demonstrates why I have been taking profits so quickly!
- QQQ: -85 @ 87.54, covered 88, loss = -$37.72. Should have made $155.55
- IWM -75 @ 111.20, covered 112.45, loss = -$93.75. Should have made $180.75.
So, instead of collecting $336.30, I lost -$131.47. Still not a bad loss and it has been dealt with.
Now, for a new position; long QQQ in the form of OTM calls.
Volume for the 89.63 strike JUN14 calls was exceptional today, 50% of open interest. 89.63 is the next resistance for QQQ, and it has broken it's 50MA and 88 resistance that it has failed several times at over the past month. No doubt, many of the 30+ thousand contracts traded were on the short side, but I think traders are ready for QQQ to push higher.
I jumped in with them: +2 QQQ JUN14 89.63 calls @ 0.95
I'll be super pissed If I get whipsawed and QQQ is down hard tomorrow. Don't add insult to injury, markets.
Friday, May 9, 2014
May 9 Weekend Review
Bflakaz Weekend Review
May 9, 2014
Recap
of Previous Week's Trades
- GMCR +100 shares @ 90.25 (SHOULD HAVE HELD IT), out @ 93, profit = $275
- IBB -50 shares @ 234.38, covered 222.50, profit = $494
- GMCR -85 shares @ 95.38, covered 90.53, profit = $412.25
- TSLA -1 195/190 MAY14 put spread @ 3.95, covered 4.00, loss = -$5
- IWM -75 shares @ 111.20, now 110.03, profit (unrealized) = $87.75
- QQQ -85 shares @ 87.54, now 86.80, profit (unrealized) = $62.90
Management
of Current Positions
IWM

The short thesis for IWM (Russel 2000 tracker ETF) was that the index
is significantly overvalued and is do for a serious
correction. Word got out that IWM was approaching the 200MA, which it
had not closed below since late 2012. For this reason, it has seen
strong support at the 200MA several times in the past month, but has
closed below it 4/5 days this week. I've been short since Tuesday and
plan to stay short next week unless my stops are hit at 111.50, or if
IWM reaches the “V reversal” point at 107 from February, which
was caused by short term overselling due to the Ukraine ordeal. That
said, Friday's action was a little unexpected, closing at the highs
of the day but not quite hitting the 200MA. I'm a tad worried for
early next week based on that, but hopefully I can stand my ground.
QQQ

The short thesis for QQQ is similar to that of IWM in that the tech
bubble is popping and momos are crashing. Well, they already crashed.
Look at TWTR... Jesus. Are the momos finding a bottom? Perhaps. If
that's the case I already have a strategy planned. For now I remain
short QQQ and will not cover until a close significantly above some
good resistance at 88 or if it hits my target of 84. QQQ has some
moving average convergence happening, which usually isn't a good
sign.
Trade
Setups for the Upcoming Week
Watching my shorts and for a bottom in momos. 30-60 day long
call/short put spreads (depending on IV percentiles) is the planned
strategy. Probably won't make a move on TWTR though, don't catch
falling knives! More like AMZN, NFLX, FB, etc.
Some
Side Notes
Get shorty, stay shorty. Those short plays I had from way, way back
in March could have been EXTREMELY profitable had I stayed with the
trend. Hindsight 20/20. I'm talking tens of thousands. Oh well.
As for the hot streak ending, it really hasn't. Earnings plays are
essentially coin tosses, but with 66/33 odds instead of 50/50 if you
do it right. Luck was not on my side, I guess, with TSLA. And I only
lost $5 because IV got absolutely hammered the morning after TSLA's
earnings. The real trial of the hot streak comes next week...
hopefully my QQQ and IWM shorts don't blow up in my face with a huge
gap up! But, as I've said before, it's not about being right or
wrong, it's about how you manage being right or wrong.
Honestly, I need more work on managing winners rather than losers.
I've been too quick to take profits, when, if I had maintained the
position, I would have had much greater gains. If I had held my +100
shares of GMCR from Monday to today, I would have made $1809. But
this has been a volatile market, and even though I've been “taking
profits early,” I'm up better than 50% ROC, and 22% ROI, just since
I started this log. In this industry, all you get is a pat on the
back for that. It's only been a little over a month... will I hang on
to those gains, those returns? Who knows, but I'm confidant that I
will perform better as time goes on and as I learn more.
In addition, in future posts, I may nor may not post nominal gains.
The point of this log is to, well, LOG (haha) my thoughts, not “show
off” how much money I've been making, which I personally don't
think I'm doing. Point is, if anyone reads this (doubtful), I don't
them to think that it's about making money. It's about a journey; the
successes, failures, mistakes, etc. Therefore, here's a snapshot of the spreadsheet since March 22.

Note that ROC considers a growing capital pool, not calculated based on starting capital. It is also worth noting that equities have substantially less risk than options, so when viewing the ROI vs Cap. Used as % of Total and going "holy smoke! options rule!," consider that. Additionally, all my equity trades are done on 50% margin.
Wednesday, May 7, 2014
The Hot Streak is Over...
But there's a silver lining. TSLA may not have gone well today, but I managed to luck out of what would have been a very big rookie mistake!
Sold a TSLA 195/190 MAY14 put spread for 3.95, making max loss only -$105. That's not bad, and it was a great trade (even though it will be a loser, most likely) because max gain was so much larger than max loss, plus the IV crush and yadda yadda yadda see this.
It's a good thing I closed out my GMCR position at lunch time today, or else I would have been in for a world of pain. Entered short yesterday -85 shares @ 95.38 and closed today @ 90.53 for a profit of $412.25. GMCR reported earnings after the bell, unbeknownst to me, and is now up greater than 6% to 98 and change. Whew!
Was very tempted to stay short IBB today but also sold out at 224.50, capturing a $494 profit. I remain short on QQQ (-85 shares) and IWM (-75 shares), although I was also very tempted to close those as well. Profits could have been $155.55 for QQQ and $180.75 for IWM, but as of now unrealized profits are at $83.30 and $81 respectively.
Total for the week: $1,181.25
- GMCR: $275+$412.25=$687.25
- IBB: $494
Monday, May 5, 2014
GMCR bouncing on a trampoline!
Bought to Open 100 shares of GMCR @ 90.25, now at 92.87 (looking for 93), profit (unrealized) = $262. Stop set at 92.50. UPDATE Sold 100 shares GMCR @ 92.9999, profit = $275
IBB also bouncing today but my short is still in the green. Stop (not set) around 235-236, above resistance level.
QQQ IWM not as weak as I expected, have not opened short position in either.
IBB also bouncing today but my short is still in the green. Stop (not set) around 235-236, above resistance level.
QQQ IWM not as weak as I expected, have not opened short position in either.
Saturday, May 3, 2014
May 2 Weekend Review
Bflakaz Weekend Review
May 2, 2014
Recap
of Previous Week's Trades
- GMCR short 85 shares @ 93.80, covered @ 90.50, profit = $280.50
- IBB short 50 shares @ 234.48, now 229.05, profit (unrealized) = $271.50
Management
of Current Trades
GMCR
I have maintained a short bias on GMCR for a month now, and have
dipped in and out of short positions since. I still maintain that
GMCR is going lower and will eventually gap fill, but I did not want
to risk holding over the weekend for a potential gap up on Monday, as
GMCR is now reading as oversold on most indicators.
IBB

IBB is the NASDAQ Biotechnology Index, and the biotech bubble is
crashing. Came in Thursday when W%R (basically a shorter term version
of RSI) signaled overbuying, and IBB hit the resistance level and
failed at 235. The short thesis here was outlined earlier this week
in my New Trade Ideas post. I expect a bounce at the 200MA around
222, which leaves room for a potential $624 profit.
Trade
Setups for the Upcoming Week
QQQ

This is looking like a beautiful short setup on Monday. Markets
overall had really nothing to say about the April Employment Report
(+288k, UR down to 6.3%, 5.5 year low) so QQQ was not able to close
above resistance at 88, and it touched both the 50MA and 100MA, which
are acting as resistance and support respectively. W%R is showing
overbuying, and due to the fact that the Dow just made another
all-time high, I think QQQ will be weak next week. Looking to short
85 shares early Monday.
IWM

IWM is an ETF that reflect the Russel 2000, which I eluded to in the
New Trade Ideas post earlier this week. The only problem with this
trade is that EVERYONE CAUGHT ON. IWM has been bouncing hard off the
200MA due to buyers flushing out shorts who want to push this thing
under the 200MA. IWM shows neither overselling or overbuying on my
indicators, and it's kind of in an “airy” area. But it has been
in downtrend for a month, and I feel this might be weak next week to
in the same way QQQ will be.
Some
Side Notes
I will begin to use smaller positions going forward, as I have done
so well I'm in almost disbelief. I've been on fire! But these hot
streaks never last forever, and sooner rather than later, I will end
up being catastrophically wrong and lose a good chunk of change...
UNLESS I reduce position sizes. These next few trades will be done on
the equities side, since I don't like to use index and ETF options,
and to also reduce risk.
In 2013 I made just over $10,000... from a combination of pure luck
and gains from good old fashioned value dividend investing. In the
first 4 months of 2014 I've made over $12,000, purely from trading,
and in much worse market conditions! It's time to ease off the risk
and play it safe on the coming months.
Subscribe to:
Posts (Atom)