before I forget, here are some trades made recently
FB earnings strangle. sold tuesday bought back yesterday. 0.40 to 0.06 for a profit of 170
GPRO earnings play, a bull put spread. oct31 66/67 for 0.55. I was expecting a short squeeze, and we got exactly that. up 15% after earnings beat. will buy back tomorrow morning.
for tests on earnings I also paper traded some atm straddles in LNKDand GPRO. but those will be elaborated upon in my next good trade - bad trade post
Thursday, October 30, 2014
Tuesday, October 28, 2014
GPRO Success, On To FB
GPRO had a nice 8% bounce today, a little short covering rally. I was able to get out of that put spread for 0.10, netting $120 for a 60% gain. Why hold this until earnings when I can bank profits today? I'll take that!
FB reports earnings tonight. So I took a small position in the form of a short strangle 2 SD OTM. -4 70/90 for Oct31. IV is super high, so the crush will book some nice profits hopefully.
I'm remembering back to July of last year when I did the same thing... that was FB's turnaround earnings report. The stock soared 30% from 26 to above 30, and now its at 80. Nobody saw that shit coming, and I got my clock cleaned. Hopefully this time will be different... hopefully.
AAPL is up 1.4% as of writing, and the call spread is trading at about 1.60. That's an unrealized loss of $66 so far. Nothing I can't handle and it's getting more overbought in the process, but I never had much faith in it anyway, therefore I didn't risk hardly anything on it!
Monday, October 27, 2014
GPRO Options Opportunity
I've made money in these options before trading the probabilities, and I'm going to try my hand at it once more.
GPRO reports earnings after the bell this Thursday. 0.08 EPS is expected. I believe the chance of a short squeeze post earnings is real, and here's why:
GPRO reports earnings after the bell this Thursday. 0.08 EPS is expected. I believe the chance of a short squeeze post earnings is real, and here's why:
- GPRO is already down 31% from its ATH
- Over 40% of the float are short, so for new short positions, its practically impossible to borrow shares
- Puts are way more expensive than calls, because investors want downside protection
So, because of these reasons, selling puts can be an attractive wager. On the Oct 31 put spread 10% below the market, a 0.50 wide spread will net you a credit of 0.25. That's pretty nuts, its a 1:1 risk-reward ratio!
If GPRO does anything but decline more than 10% on Friday, these sold puts will make money. And if it does go below the strike price, you can only lose the credit you got, or 100%. Usually on credit spreads, your max loss far exceeds net credit (but the probability is in your favor). Here, you can either make $25 or lose $25, and the odds, in my honest opinion, are in the put seller's favor.
In addition, the expectation is that GRPO falls like a rock. I can't find one positive opinion out there, or even a neutral one! Everyone on StockTwits is pounding the table on $50 as the next stop. To me, I'd rather take the risk of a coin toss and go Delta positive.
Here's the trade: -8 GPRO Oct31 60/59.50p @ 0.25
Max Risk and Max Profit are both $200, so nothing spectacular here.
Friday, October 24, 2014
I Don't Like Waiting...
There ain't a whole lot going on right now in the stock market. We've retraced a good chunk of the losses of the past couple of weeks, yes, the BTFD crowd is alive and well.
My methodology is support/resistance and overbought/oversold. So, currently, nothing is really happening. I missed most of the long opportunities from the rebound. But hey, can't catch 'em all, right?
So now I look to Apple (AAPL)

AAPL just reported solid earnings and gapped up a few days ago. It reached a fresh ATH today, and today's candle is completely outside the top bollinger band. RSI is below 70, and the stochastics are just now signaling overbuying, so I hope I'm not too early on this one. I believe that it can move down to gap fill or the 20ma, whichever comes first. Or, it could keep running higher, I don't know. That's why I'm not risking a whole heck of a lot here.
Bought 2 DEC14 105/100p for 1.93... max risk = $386 or 1.93% of capital.
My methodology is support/resistance and overbought/oversold. So, currently, nothing is really happening. I missed most of the long opportunities from the rebound. But hey, can't catch 'em all, right?
So now I look to Apple (AAPL)
AAPL just reported solid earnings and gapped up a few days ago. It reached a fresh ATH today, and today's candle is completely outside the top bollinger band. RSI is below 70, and the stochastics are just now signaling overbuying, so I hope I'm not too early on this one. I believe that it can move down to gap fill or the 20ma, whichever comes first. Or, it could keep running higher, I don't know. That's why I'm not risking a whole heck of a lot here.
Bought 2 DEC14 105/100p for 1.93... max risk = $386 or 1.93% of capital.
Wednesday, October 15, 2014
A Couple New Risk-Averse Positions
All cash lasted a while, didn't it?
I liked the price action in 2 ETFs today: TLT and XHB


I liked the price action in 2 ETFs today: TLT and XHB
iShares 20+ Year Treasury Bond Fund (TLT)
TLT is looking overbought, which isn't surprising given that stocks are getting hammered. Today though was just ridiculous. TLT flew higher and then closed below where it opened, which to me is short term bearish. the 10 year treasury bond dipped underneath 2% today for the first time since June of 2013, as it become more and more apparent to traders that the Fed obviously isn't going to raise interest rates.
Today I bought 4 of the Dec14 122/123p for 0.60... that's a max risk of $240 or 1.2% of capital.
SPDR Homebuilder ETF (XHB)
This is both a support play and a (kind of) hedge. Home builder stocks are pretty interest rate sensitive; if rates rise, mortgages are more expensive, demand for housing declines, they build less homes... and vise versa. XHB tagged its June 2013 double bottom lows, and is outside of its weekly BB range, which are much stronger ranges on weekly candles than daily. The fact that it closed up 1.66% today was a good sign given that stocks had their worst day since 2011... but even they pared losses to close down 0.75%.
I bought 5 of the Dec14 28/29c for 0.47 shortly after XHB reacted to that support level. They're now at 0.55, so I've logged paper profits of $40 already.
The hedge works like this: if TLT declines, XHB might as well. If TLT goes up, XHB might as well. Since XHB trades off of interest rate changes (mainly the 20+ year rates), it may react in tandem with TLT since that is a proxy for 20+ year rates.
Why the hedge? Well, check back to my post on October 1st, I called for the Russel 2000 to "fall precipitously and swiftly right down to 1040" if support around 1080 was broken. Yeah, I was totally right. But I didn't make a position! How foolish! As my SPY calls were getting destroyed, I could have been making a killing in IWM puts!
So, as long as the market is bleeding out, I will attempt to hedge my bets. It's been a long while since stocks have seen volatility like this, so there's no reason to start throwing money around.
Additionally, other opportunities that I was looking at and totally missed were GLD and, um, a SPY short! Instead of getting out and going short I started to defend why I was long the SPY... a mistake. I've been bearish on stocks all god damn Summer. Yet, there I was, pretending to be bullish because I had a long position. Lesson learned.
Here are the charts to go along with:
SPDR Gold Trust (GLD)
SPDR S&P 500 ETF (SPY)
Monday, October 13, 2014
Aaaaaand I'm all cash.
Read the previous post for market outlook.
PROOF that all the trades made were good trades, even though the stocks continued to move against me the entire time! Thanks, rolling strategies!
TKMR summed profit = $300
GPRO summed profit = $160
SPY loss = -$200
SCTY summed profit = $54
VIX profit = $150
Total = +$464
So even though the markets were in total free fall last week, I still managed to eek out some gains! The profits would have been much better if the market didn't tank last week, but that move only proves that they were good trades.... well, maybe not SPY. As it turns out, that's a name I haven't been very good at trading.
While I'm pissed that I didn't get the chance to pile in for the bear mauling because I was managing all these trades going against me, I'm very pleased with the result of all that feverish adjustment.
So for now, until the market catches a god damned bid, I will remain all cash. Being up almost 80% this year, I don't need to trade in a free falling market. Better to hang on to those gains, right?
Sunday, October 12, 2014
Sifting Through the Correction Noise
Last week was a bad week for stock markets... not just here, but globally. Many of the bears have come out of hibernation and called for the start of THE correction. I'm well-read on each and every bit of information they throw out to support their case, because I agree with (pretty much) all of itl the global economy is not growing, monetary policy isn't working, etc. I am in their camp when it come to being "bearish" on the economy...
Where I differ with them is their opinions on stock markets. Yes, I believe stocks are significantly overvalued. Yes, I believe that QE and ZIRP have caused massive miss allocation of resources in the economy. But do I believe that this is the tipping point? The start of a correction? Maybe. A reversal in trend, and potentially a bear market? Absolutely not!!
If you have been short the market at any point since 2009, you have lost money. Even looking at this year you have lost money, even as the Fed has been tapering off QE and discussing rate hikes. In late January and into early February, stocks had a nasty sell off due to the Ukraine crisis. What happened after? Stocks went higher. In April, stocks sold off because technology stocks were thrown out of favor by investors, mostly the nose-bleed value ones that generate no profit. Stocks went higher after. In early August, stocks sold off on the back of more negative news. Stocks went higher after.
The bears claim that this time is different. They have been saying this for years. It is NOT different! They claim that stock markets declining past their 200 day moving averages means more turmoil is ahead. While no one can be sure if this is going to be a full on correction, I highly doubt that this is the start of a reversal. And I've been calling for "this correction" since the beginning of the Summer.
First of all, ZIRP isn't going anywhere! Nobody in the US economy can afford higher interest rates, not even the government! All this talk of rate hikes is meant to spook investors and let a little air out of the bubble. The Fed may follow through with "ceremonial" rate hikes - 50 or 75bps - as to look like they've kept their word.
Some excuses they may use for not raising them further may include:
- "Inflation is not running at our long term objective of 2%"
- "The labor market still shows slack"
- "Higher inflation can be tolerated after years of low inflation"
- "We don't want to cut off the recovery as soon as it finds its footing"
- "Recent trends in the currency market have allowed the committee to be less constrained in their timing of further rate hikes"
The FOMC has been extremely selective in their choice of words recently. They have been whispering things like, "The market's idea of the timing of rate hikes are not in line with the committee's," or, "Investors are not perceiving the risk of losses as real." They're trying to let the air out! They know god damn well that a real rate hike is pretty much impossible.
One way to tell this is that the bond market is totally calling the Fed's bluff. Look at 10 year treasury yields YTD for 2014:
Yields have done nothing but decline even though inflationary pressures have continued to rise and the Fed has been tapering QE and discussing rate hikes. In fact, they are at their lowest level since the taper tantrum in May of 2013!
#5 in the aforementioned list refers to currency market trends. Since investors on the whole believe that a rate hike is coming, and the ECB is planning to unleash a QE program and Japan prints indefinitely, the Dollar will appreciate in relation. The markets have already priced in a potential rate hike. What happens when that silly notion dissolves? Let's look to the past:
In 2010 the Dollar had a massive rally on the backs of the European debt crisis and the belief that the Eurozone may break up. That didn't happen, the crisis was largely contained, and the fall in the Dollar was just as precipitous as the rise! You mean to tell me that slowing growth in Europe and an obvious balderdash of a rate hike justify a rally in the Dollar like the Euro crisis did?! No, and it will soon decline as that realization sinks in.
In conclusion, while a correction is long overdue and may occur in the following weeks, it is very likely not the start of a reversal.
Wednesday, October 8, 2014
Trade Management 10/8/14
We've experienced some choppy, volatile trading in stocks this week. Here are some updates on positions.


SCTY
Converted this to an iron condor from a bull put yesterday and may have overcompensated. Old resistance was blown through on a large down day for stocks, maybe I jumped the gun.
The red lines are the range of the condor, blue are support/resistance, and green is a rough channel that SCTY has been in since the triple top. I expected SCTY to bounce more off the 55 support, but it did not want to get past 60, and sold off violently. Now instead of being a delta positive position, I've got a delta neutral, and it could head higher... sweet! (sarcasm) Part of that was me forgetting that I was in November contracts, not October, like the other credit trades I've got on. Rookie mistake and I'll probably pay for it...
SCTY jumped over 3% to 57 as I wrote this, come on man! :(
GPRO
Elaborated yesterday, the GPRO strangle has a wide range; the top end is off the chart! Blue lines once again show support, although this stock hasn't been trading long enough for it to form real support and resistance, so take those with a grain of salt.
TKMR
The ebola play lost steam as its drugs ended up not being used to treat the Dallas ebola patient. It sold off (as expected), and got dangerously close to the 20 short put. I rolled down the 35 call to 30 yesterday, so I now have a tighter range. The Dallas patient died today, and now CRMX or w/e has switched places with TKMR, so I'm a little worried this may see a resurgence. Take support/resistance lines with a grain of salt, again.
SPY
Holy Fed minutes batman! SPY tagged a double bottom today and is now forming a bullish engulfing candle, signaling a move higher. In addition, MACD is reading a divergence and is at previous "bounce" levels, so that is a good sign.
More importantly for the 196/198 bull call trade though, SPY must hold its long term bullish trend:
SPY has to close out the week above that trend line, or else we might see a further decline past 190.
The trend is your friend!
Tuesday, October 7, 2014
A Lesson in How to Properly Trade Options
Many retail traders have a gambling mentality. They think that a 1:3 risk:reward ratio is a good bet. What they fail to understand about trading is that it is not gambling, just like gambling is not betting.
Betting means taking a look at the odds... let's use horse racing as an example.
The following horses have these odds. Which one is your best bet? (1/10 means bet $1, receive $10 upon win)


Betting means taking a look at the odds... let's use horse racing as an example.
The following horses have these odds. Which one is your best bet? (1/10 means bet $1, receive $10 upon win)
Hoof Hearted............1/10
Seabiscuit.................1/3
Dapper Dan..............1/99
Kentucky Pride........1/36
Mr Ed.......................1/7
It's obvious that Seabiscuit has the best odds of winning. In response, his payout is substantially lower than the other horses. A risk-on better would put $20 on Hoof Hearted, a gambler would put $20 on Kentucky Pride (Dapper Dan ain't gonna win), and a betting man would put $10 on Seabiscuit. The house always wins, so this is still gambling, per say, but it's an analogy.
(I would personally bet Seabiscuit and Mr Ed in a perfecta box)
The same thing goes for options trading. Options are priced based on their probability of retaining intrinsic value upon expiration, meaning they can be profitably traded for shares at that time. What many retail traders fail to understand is this fundamental point. That, and they don't understand the other mathematical variables at play, aka the Greeks.
The Bad Trader
A bad trader will take a look at the following:
The bad trader will determine that the 100 strike call is a good trade. What is his analysis?
The Bad Trader thinks paying 3.50 x 100 = $350 is cheaper than paying $97 per share. He's right; in order to make the same gains he would need to buy 100 shares, $9700 compared to $350 He thinks that this is a "cheap" trade, and that he can only lose $350, right?
The fact is, GPRO must advance from 97 to 100 PLUS the price he paid for the call, 3.50. GPRO then must rise 6.7% by expiration to BREAK EVEN on the trade. It must rise far higher and faster than 103.50 in order to make any money. That certainly could happen, but everyday that it doesn't, the extrinsic value of his call option will diminish, no matter where GPRO goes. He only has 11 days for that to happen, 9 of which are trading days. Yes, even over the weekend, his call option loses value. This is called theta decay, elaborated here.
The Bad Trader also does not ask why the heck a call option so far out-of-the-money with such little time to expiration is priced so high. This is due to the underlying stock's implied volatility. The more a stock moves, the higher the IV, the higher the option price. To compare, here's an option chain of a low IV, similar price stock:
Notice how the strike call that is equidistant OTM as 100 is to 97 (3%) is 106. The 106 call is trading at 0.30! less than 1/10 of the GPRO strike. And the irony is the Bad Trader would make the same mistake, thinking the 106 call is cheap and buying it.
These kinds of trades happen all too often in retail trader world. After all, only 1 in 10 people who try their hand at trading will ever make money. What happens to the Bad Trader's GPRO 100 call? It will probably lose a lot of value this week, especially if GPRO doesn't move all that much.
A bad trade can still make money; the 100 call can still rise from 3.50 to 4.00, 4.50, 5.00, but that's GAMBLING. The chances of that happening are against him, heavily. This trade will most likely lose money.... a lot of money.
The Good Trader
The Good Trader knows all the inputs of an option price, and how to trade around them. He has studied the markets, and has probably lost money falling for the gambling mentality. But he has learned from that mistake. The good trader trades based upon PROBABILITY.
The Good Trader doesn't look as cool; he doesn't make huge profits like a gambler, but makes small profits consistently. In the long run, the Good Trader will win out. These are the 1 in 10.
The Good Trader will use statistical analysis when making his bet. He looks at a high IV stock like GPRO with a keen eye. He notices premiums are very high given the days to expiration (DTE) and decides to capitalize.
The Good Trader firsts tests his trade by pulling up a risk profile:
He observes the standard deviation lines (yellow) and the mean price line (blue), and then calculates the percentage chance that this trade expires OTM. This is done using Z-score.
Z = (x-µ)/Ϭ
where x is the strike price of the sold option, µ is the mean price, and Ϭ is the value of 1 standard deviation. From the above model, he can estimate that µ = 97 and Ϭ = 11. This gives him
Z = (115 - 97)/11 = 1.63
With this Z = 1.63 he can look at a bell curve and analyze the percent chance of the stock being at a price above or below our sold strikes (115 and 77.5). Thankfully we have the internet, and do not need to calculate this by hand.
The chance of the price rising or falling below or above our sold strikes upon expiration is 10.31%, and the chance of the price being somewhere in between the sold strikes is 89.69%.
Those are very good odds! The Good Trader places the trade, selling the 77.5 puts and 115 calls for 1.25 credit, meaning his maximum profit is $125 per spread. He does this 10 times, so his max profit is $1250.
If GPRO stays in between 77.5 and 115 for the next 5 or 6 days, he will profit immensely. If GPRO's IV percentile declines between now and expiration, he will profit even more.
Conclusion
The Bad Trader is essentially gambling that GPRO will rise even more, even though it has already risen substantially in recent weeks. The Good Trader is playing the odds heavily in his favor, and has a higher chance of making more money. Can the Bad Trader make money and the Good Trader lose money? Absolutely. But, the Good Trader had the better odds, and as long as he managed his loss and didn't bet more than he could handle, he will be fine. The Bad Trader, however, will fail to learn from the mistake since his trade made money, and will go on to continue recklessly gambling until his account goes to $0.
Wednesday, October 1, 2014
October Gets Off to a Spooky Start
But opportunity is here!

Now THAT'S terrifying!
Popping up on the radar this time are SPY, SCTY, TMKR, RUT, and the VIX
SPDR S&P 500 ETF (SPY)

Looking at the RSI and W%R, we're right at the "rebound" levels experienced on a weekly chart sine the onset of QE3 in September of 2013. We are also right on that weekly trend line since March of last year. If that fails to hold at this week's close, we might be in for some trouble. I don't think that's going to happen, I think the BTFD herd will come swooping in tomorrow and Friday, especially if we get a good September employment report. Today's big down move was apparently on the back of Ebola coming to the US and slowing growth indicator prints globally, though most notably in Germany. If we close out the week above that trend line, I'm looking to trade an ITM/ATM call spread for November.
SolarCity Corp (SCTY)

SCTY has been getting "moliwhopped" lately, declining about 17% last month. While it would have been a good short, and I know a few people who correctly predicted that move, but its oversold and good support is right around the corner. 1st is right around 54, the take off point (which blew up one my iron condor back in June). 2nd is the start of the "run-up-to" the take off point, and 3rd being that strong double bottom just south of 47. I will wait to see if support is confirmed at the 1st line before selling a put spread beneath the market, as IV is north of 60%.
Tekmira Pharmaceuticals Corporation (TKMR)
Don't need a chart for this, it's pretty simple. This stock was up over 30% today on the news of Ebola (one case, contained, and in Texas) coming to the US. This company makes hazmat suits. That's pretty much it. The stock has more than doubled in under a month but also sold off over 50% prior to that, meaning IV is, yeah, SUPER HIGH! OVER 100%! That means we can get crazy far away from the market for a call spread or strangle... except, the move was unanticipated, and there are no strikes that far away from the market on the call side to even trade. We'll see if that changes in the coming days, but if it doesn't happen soon, the trade might be gone.
RUSSEL 2000 Index (RUT)

Oh boy. The Russel 2000 is an index of small cap "growth" stocks (momo), and it's been having trouble getting anywhere this year. In fact, it's down on the year. Market top? I don't know, but it's once again sitting on that key support level. If that's broken, the shorts are going to pile in to this thing via its tracker ETF IWM. It's entering oversold territory, but that will not stop a bear mauling! If we fail to see a bounce here, naked puts on IWM will be attractive: the fall will be precipitous and swift, right down to 1040 at least. If we catch a bounce, a call spread will suffice, as it has rocketed off this support multiple times.
S&P 500 Volatility Index (VIX)
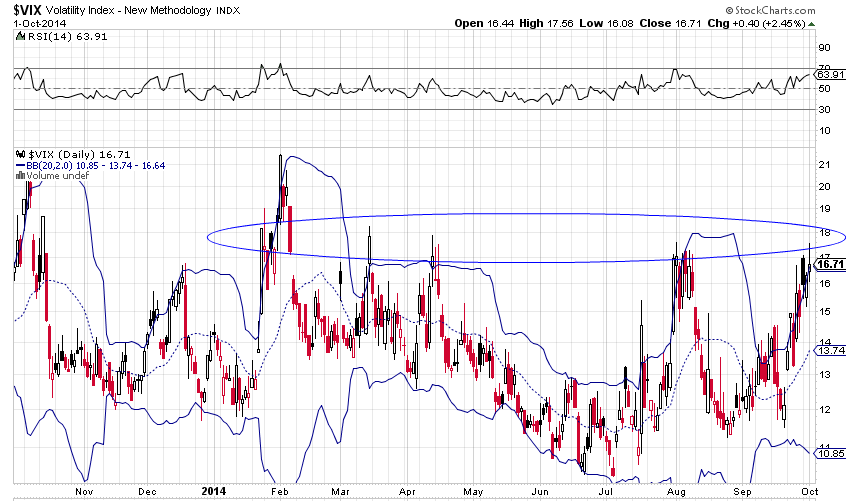
As you can see, everytime the VIX reaches this 17ish level, it drops quickly back down to its average area between 13 and 14. This time is no different, and if the S&P 500 is set to bounce of support, then the VIX will fall right back down. Selling Oct14 20/22 calls @ 0.30 will most likely prove profitable.
Subscribe to:
Posts (Atom)